Logs
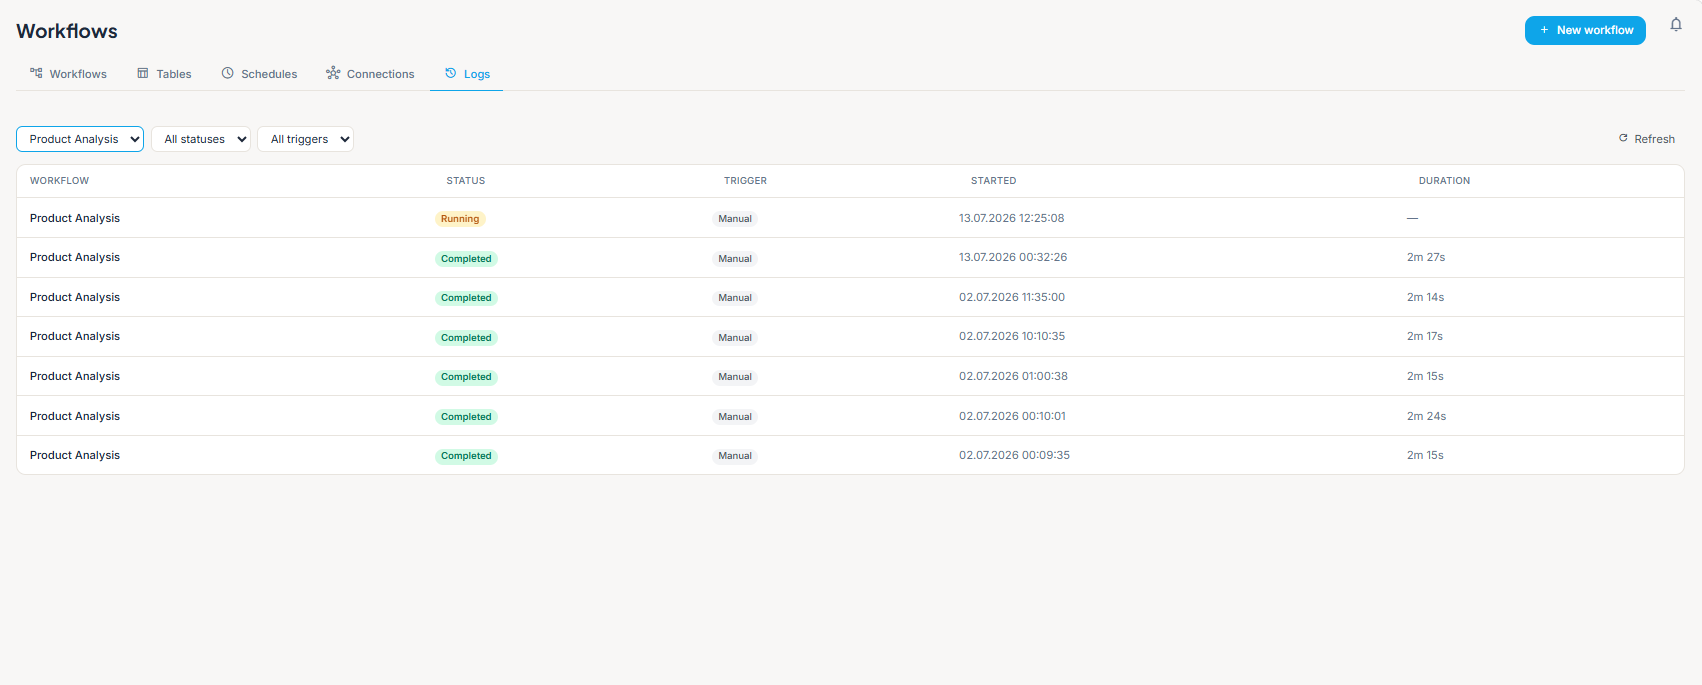
Every workflow run is recorded — whether you started it yourself, a schedule fired it, a webhook arrived, or it was launched from a chat. The Logs tab is where you read those runs back: which workflow ran, how it ended, how long it took, and — one click deeper — exactly what every single step received and produced.
This is the page you open when something didn't happen the way you expected.
:::info Logs covers the whole organization The Logs tab is an admin view. It lists runs of every workflow in your organization, not just the ones you created. :::
Opening Logs
Go to Workflows → Logs.

The tab has three parts:
- A row of filters on the left and a Refresh button on the right.
- The runs table.
- Previous / Next paging under the table, when there is more than one page of runs.
The runs table
Each run is one row.
| Column | What it shows |
|---|---|
| Workflow | The workflow that ran |
| Status | How the run ended, or where it is right now |
| Trigger | How the run started |
| Started | The date and time it began, in your local time |
| Duration | How long it took |
A few things the table does on its own:
- Failed and cancelled runs get a faint red tint, so problem runs stand out while you scroll.
- A run whose workflow was deleted shows (deleted) in the Workflow column. The run stays in the history as a record, but it can't be opened — clicking it tells you "This run's workflow was deleted — no execution detail."
- Click any other row to open the full run detail.
Run statuses
| Status | What it means |
|---|---|
| Queued | Accepted and waiting to start |
| Running | In progress right now (the badge pulses) |
| Completed | Finished successfully |
| Failed | Stopped because a step hit an error |
| Cancelled | Stopped before it finished |
| Paused | Waiting on something before it can continue — for example a connection that needs attention |
:::tip A paused run isn't a dead run A run that pauses waiting on a connection can be resumed once you fix the connection. You do that from the workflow editor, not from Logs — see Running Workflows. :::
How the run started
A coloured pill in the Trigger column tells you where the run came from.
| Trigger | The run was started by |
|---|---|
| Manual | Someone clicking Run in the workflow editor |
| Webhook | An outside service calling the workflow's webhook address |
| Schedule | A recurring schedule reaching its next occurrence |
| Chat | A conversation with an AI assistant, after the user approved it |
This column is often the fastest answer to "why did this run at 3 a.m.?" — see Schedules for recurring runs and Running Workflows for webhook and chat starts.
Narrowing the list
Three dropdowns sit above the table. They work together — set as many as you like.
| Filter | Choices |
|---|---|
| All workflows | Any single workflow in your organization |
| All statuses | Completed · Failed · Running · Queued · Paused · Cancelled |
| All triggers | Manual · Webhook · Schedule · Chat |
Changing any filter takes you back to the first page of results.
Click Refresh to pull in the newest runs without reloading the page. This is useful while a run is still going: refresh and watch Running turn into Completed or Failed.
:::tip The fastest triage Set All statuses to Failed and leave everything else alone. What's left is your entire problem list, newest work included. :::
Paging through runs
When there are more runs than fit on one page, Previous and Next appear under the table with a counter between them showing which slice you're looking at and how many runs matched in total — for example 31–60 / 214.
Previous is greyed out on the first page, and Next is greyed out once you reach the end.
When the table is empty
The message tells you why it's empty, so you know whether to worry.
| What you see | What it means | What to do |
|---|---|---|
| No runs yet — "Runs appear here once you execute a workflow, attach a schedule, or trigger a webhook." | Nothing has ever run | Run a workflow, or give it a schedule or webhook |
| No runs match this filter | Runs exist, but not with the filters you set | Click Clear filters to reset all three dropdowns |
| Could not load logs. | The list couldn't be fetched | Click Try again |
Inspecting a run
Click a run and a full-screen inspector opens over the page. This is the detailed, step-by-step record of that one run.
Close it with the ×, by pressing Esc, or by clicking the dimmed area outside it.
The top bar
Left to right:
| Item | What it does |
|---|---|
| Workflow name | The workflow this run belongs to |
| Status | A coloured dot plus the status word |
| Trigger pill | How this run started |
| Run id | A short id — click it to copy the full one, handy when you need to point someone at this exact run |
| Re-run | Starts the workflow again from the beginning. A toast confirms "Workflow re-run started" |
| ↑ / ↓ | Jump to the previous or next run in the list without closing the inspector |
| × | Close |
:::caution Re-run and cancel are not the same button The inspector's only run control is Re-run. To stop a run that's still going, or resume one that's paused, use the status strip in the workflow editor — see Running Workflows. :::
The metric strip
A thin line under the top bar summarises the run at a glance:
- Started — the date and time it began
- Duration — how long the whole run took
- {n} blocks — how many steps were recorded
- Failed at {step name} — shown in red, only when the run failed
That last one usually answers your question before you read anything else.
The timeline
Under the metric strip is a single band showing the run as a waterfall. Each step is a coloured segment: its position is when the step started, its width is how long it took.
- Steps that ran one after another read as a left-to-right chain.
- Steps that ran at the same time (inside a Parallel block) overlap.
- Failed segments are red and carry an exclamation marker.
- Hover a segment to see the step's name and how many milliseconds it took; click it to select that step below.
If the run has no timing information you'll see "No timing data for this run" instead of the band.
The step list
The left pane is the run's trace, top to bottom, in the order things happened.
Each row shows the step's icon, a status icon, its name, and a short result line:
| Result line | Meaning |
|---|---|
| Success in 142ms | The step finished cleanly, with how long it took |
| Failed in 1.2s | The step errored — the row is red |
| Running… | Still in progress |
| Pending | Recorded but not started yet |
Loops and parallel branches nest: the container is one row with a chevron, and its iterations sit underneath. Click the container to fold or unfold it; click a single step to inspect it on the right.
:::tip A failed run opens on the failure When you open a run that failed, the first failed step is selected for you automatically — you land on "what broke" without hunting for it. :::
If nothing was recorded, the pane reads "No steps recorded for this run."
Drag the divider between the two panes to give the step list more or less room. On a narrow screen the panes stack instead, with the step list on top.
Input and output
The right pane shows the selected step's Input on top and its Output below. Until you pick a step it reads "Select a node to inspect its input and output".
- Input is everything that flowed into the step — the values its fields resolved to at that moment.
- Output is what the step produced, which is exactly what later steps read through references like
<agent.content>.
How the values are shown depends on what they are:
- Text results from AI steps render as formatted text, with small chips for the model used and the tokens spent. A Structured output link underneath opens the same result as a data tree.
- Everything else renders as an expandable tree. Top-level entries are open; nested ones start folded, so a large result stays readable. Each value carries a small type label (string, number, boolean, array, object).
If a step ran several times — a loop iteration or a parallel branch — a selector appears above the panes so you can page between the individual runs of that same step.
:::note Secrets never appear here
Sensitive values in a step's input are hidden in the record and show as [redacted]. A hidden value is not a missing value — the step received the real one.
:::
When a step failed
Select a failed step and a red error card appears above its Input.
The card leads with the error message in plain text, then adds whatever is known about the failure:
| Part of the card | What it tells you |
|---|---|
| Tags under the message | The kind of problem, an HTTP status if the step was calling a service, an error code, a Retryable flag when the same call is worth trying again, and the reason an AI step stopped |
| Details from {step name} | The step's type and id, its status, how long it ran before failing, when it started, and which iteration failed when it was inside a loop |
| On error | Whether the failure was Routed to the error branch (your workflow handled it) or Halted the run (it stopped there) |
| Copy as JSON | Copies the whole error record to your clipboard, ready to paste to whoever can help |
Directly under the card you get the Input that produced the failure — which is almost always where the real answer is.
:::tip Most run problems are data problems Steps rarely break on their own. Far more often a reference is pointing at a value that isn't there — a field name spelled differently, an empty result from the step before, a trigger that didn't carry the field you expected. Compare the failed step's Input with the previous step's Output and the mismatch usually jumps out. :::
Working through a failed run
A repeatable routine:
- Open Workflows → Logs and set the status filter to Failed.
- Click the run. It opens on the step that failed.
- Read the error card — the message and its tags say whether this is a data problem, a permission problem, or an outside service having a bad day.
- Look at that step's Input. Is every value what you expected? Anything empty or missing?
- If a value is wrong, walk one step back in the list and read its Output — that's where the value came from.
- Fix the workflow (a reference, a field, a connection) and save it.
- Come back and press Re-run, or run it from the editor.
:::caution If the error mentions a connection A run that fails or pauses because a key was rejected or expired needs the connection fixed, not the workflow. Sort it out on the Connections tab, then run again. :::
Tips
- Check Logs after every change. One run through the editor plus one read of the trace is the fastest way to confirm an edit does what you meant.
- Use the run id. Copy it from the top bar when you report a problem — it points at one exact run.
- Use ↑ / ↓ to compare. Two runs of the same workflow, one good and one bad, read side by side are a very quick diagnosis.
- Watch the timeline for slow steps. A single wide segment is where your run is spending its time.
- Filter by trigger when a workflow runs on both a schedule and a webhook and only one of them misbehaves.
Related pages
- Running Workflows — starting runs, stopping them, resuming a paused one
- Schedules — recurring runs and why one may not have fired
- Connections — fixing a rejected or expired connection
- Blocks — what each step does and what it outputs
- Creating Workflows — building and editing the workflow itself
- Workflows Overview — the Workflows tabs at a glance